Analytics
Analytics is the most important Opticks dashboard screen in terms of available information. It provides an interactive way to consult all your Opticks metrics (sessions, pageviews, conversions and more) as well as fraud information, filtered and grouped by several dimensions. It consists in 3 parts: the filter selection, the KPI widgets and the dimension selection.
The metrics shown are:
- Sessions: the number of unique sessions, similar to Google Analytics. A session duration is 30 minutes. After a 30 minutes span of inactivity, the session will be closed.
- Pageviews: the number of navigations made by all sessions. A single session can have multiple pageviews.
- Conversions: an action reported by the customer. It can be any action for which the customer is acquiring traffic, such as leads, form registrations, purchases, etc.
You can also see the respective amounts of legitimate, suspicious and invalid activity for each metric.
Filter selection
At the top of the analytics screen, customers can select both the filters to apply and the date range for the analytics table and KPI widgets. These filters will be applied to all results in the analytics table, meaning you can focus on specific data (i.e. a particular set of countries or an UTM campaign). You can combine as many filters as you want.

KPI widgets
Three widgets will show important KPI's at the head of the page:
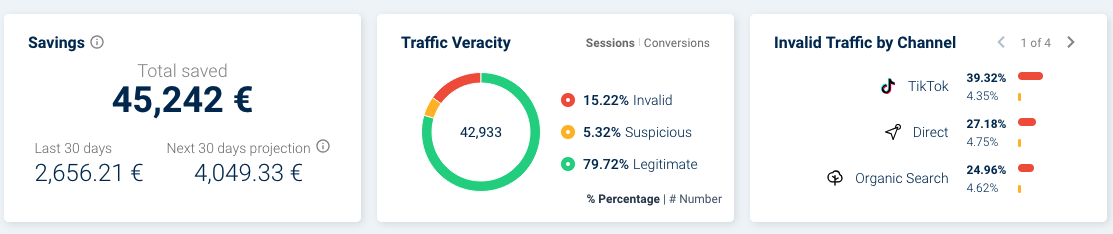
- Savings: shows savings data including total savings since your Opticks account started, the last 30 days and a projection of the next 30 days. This widget is unaffected by date selection or filters.
- Traffic veracity: displays the amount of invalid, suspicious and legitimate traffic either in percentage or total volume, for sessions or conversions. This widget is affected by date selection and filters.
- Invalid traffic by channel: ranks traffic channels ordered by invalid and suspicious traffic percentages. This widget is affected by date selection and filters.
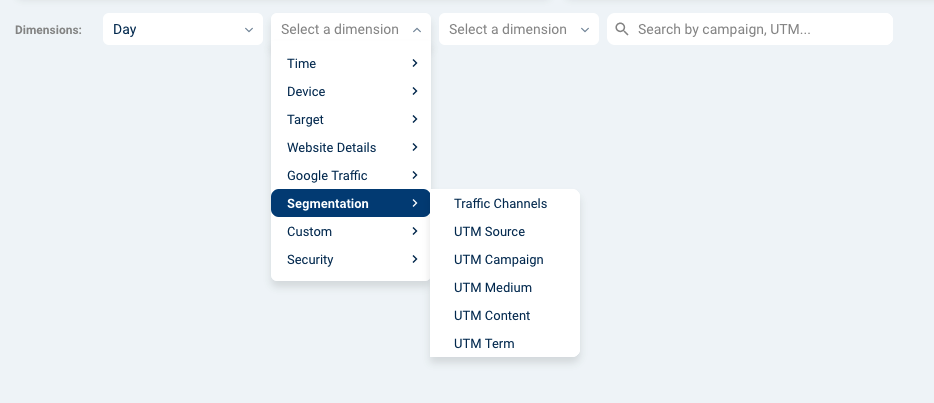
Dimension selection
Dimensions are the categories you use to break down your data (i.e. country, UTM campaign, day...). In Opticks, you can combine up to three dimensions.
Analytics results
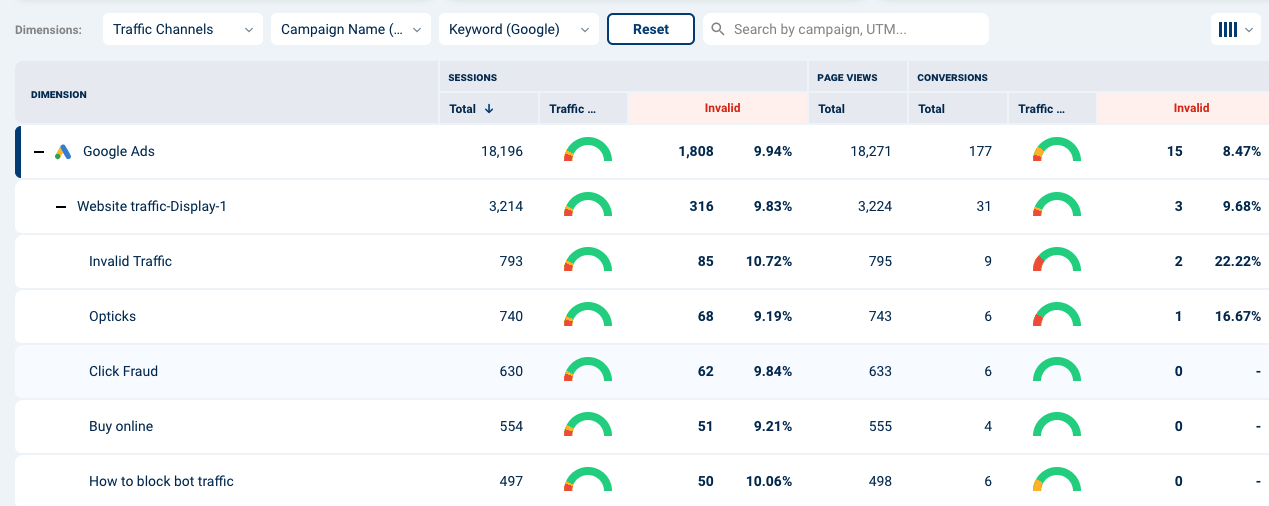
Once you have selected the desired dates, filters and dimensions, you can apply and the analytics table will load. By default, analytics screen is loaded grouped by traffic channels for the last week.
In the following example, you can see the analytics by three dimensions: traffic channel, Google Campaign name and Google keyword. That allows you to unfold rows and see the metrics of each keyword for each one of your Google campaigns, in order to find which ones are having more invalid traffic, generating better leads, etc.
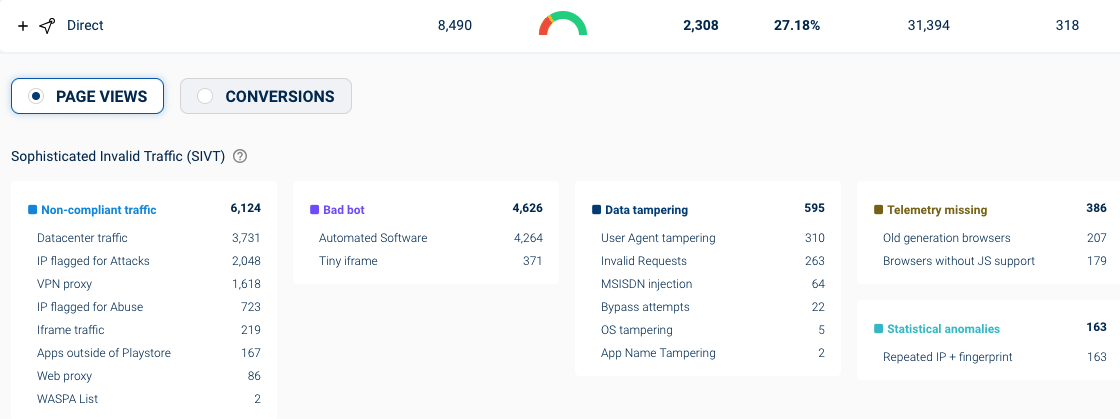
At Opticks, transparency is a core value. Therefore, when clicking in the Traffic veracity bar in any of the row, a section will open below where you can see all the invalid traffic reasons found by Opticks. You can select this for both pageviews and conversions. The complete list of threats and triggers and their explanations can be found here.
Please keep in mind that the analytics screen only shows grouped data. To see individual data (click by click), please check the Reports section.
Adding a dimension combination to the Watchlist
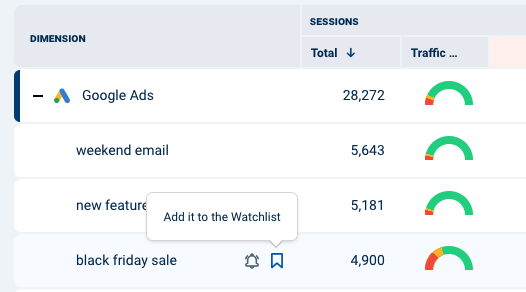
You can add any particular dimension combination, represented by a row, to the Optick watchlist. The Opticks watchlist is shown in the Overview section and is intended to keep a close look at a particular entry such as a campaign, keyword or country, combined or not.
In the example below, the combination of traffic type "Google Ads" + UTM campaign "black friday sale" would be added to the watchlist.
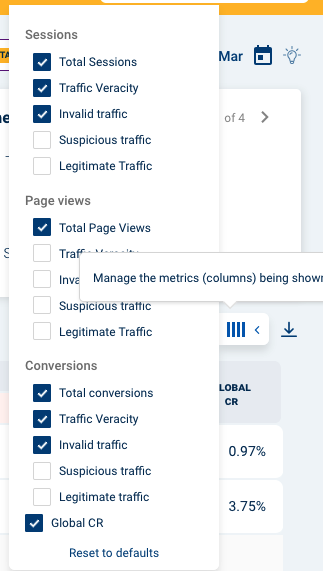
Metrics selection and data download
You can change the metrics shown in the analytics table by clicking in the metric selection button in the right side of the dimensions selection. You can also download a CSV version of the data by clicking in the download button next to it.