Reports
Opticks has a powerful reporting system that you can use to extract click-by-click data for any use such as ingestion in your system, analytics, complaints, etc.
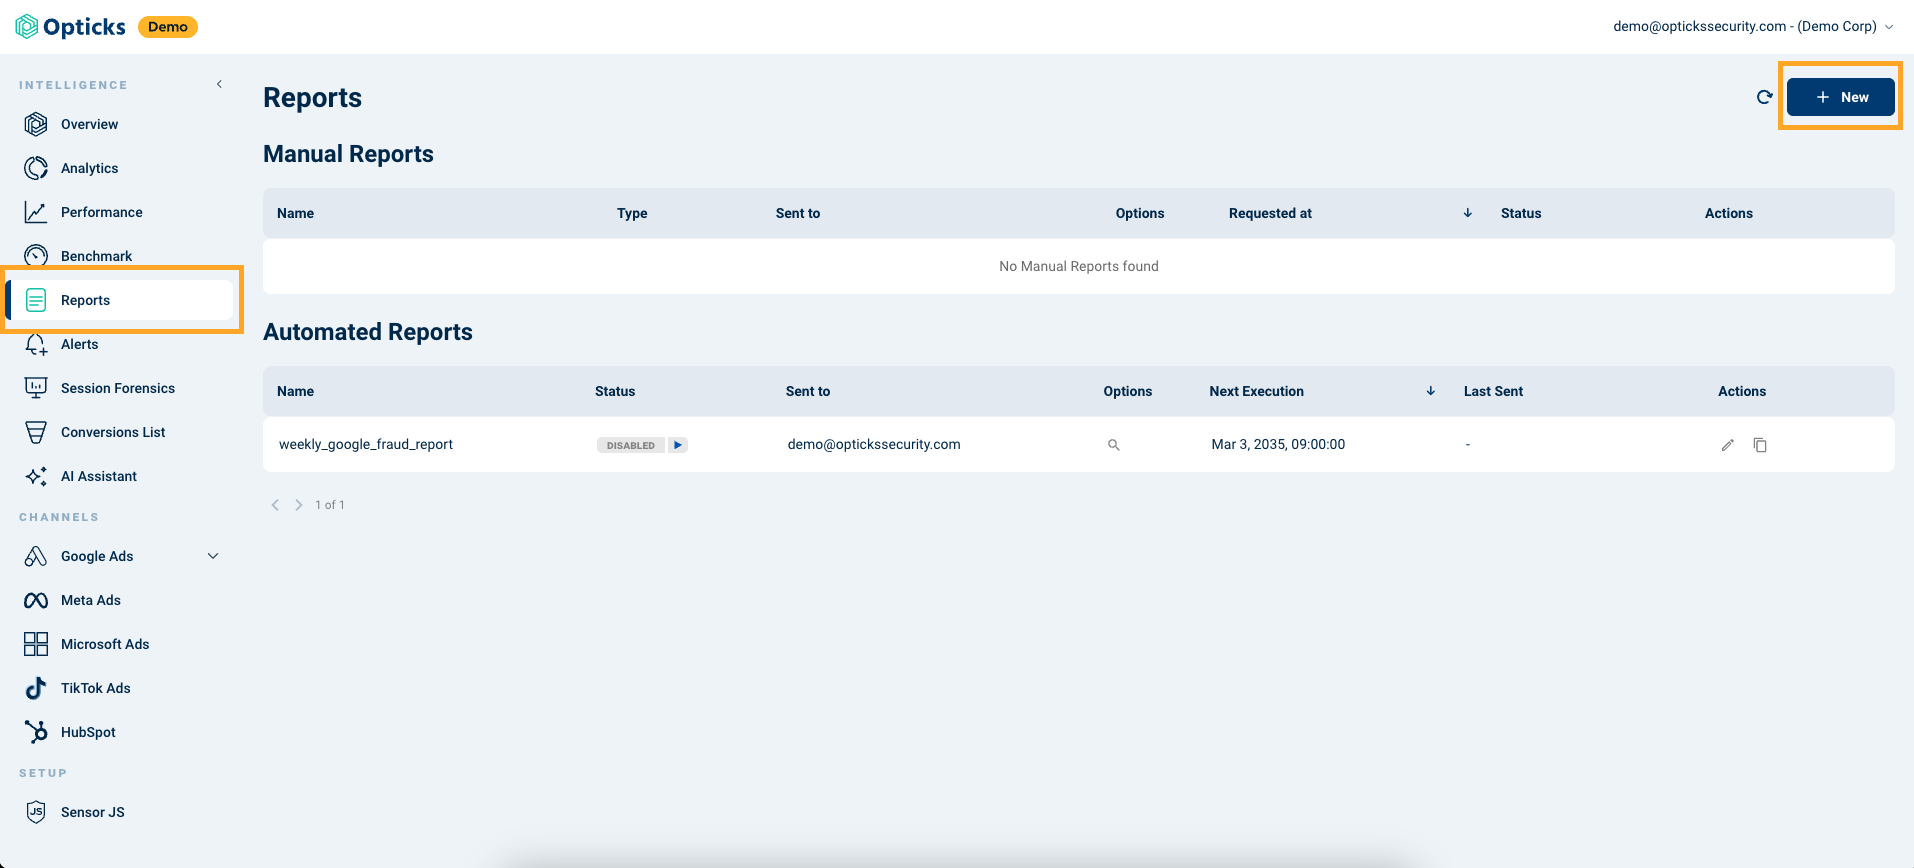
You can access the report functionality from your Opticks Back Office clicking on "Reports" option under the "Reporting" menu on the left navigation bar.

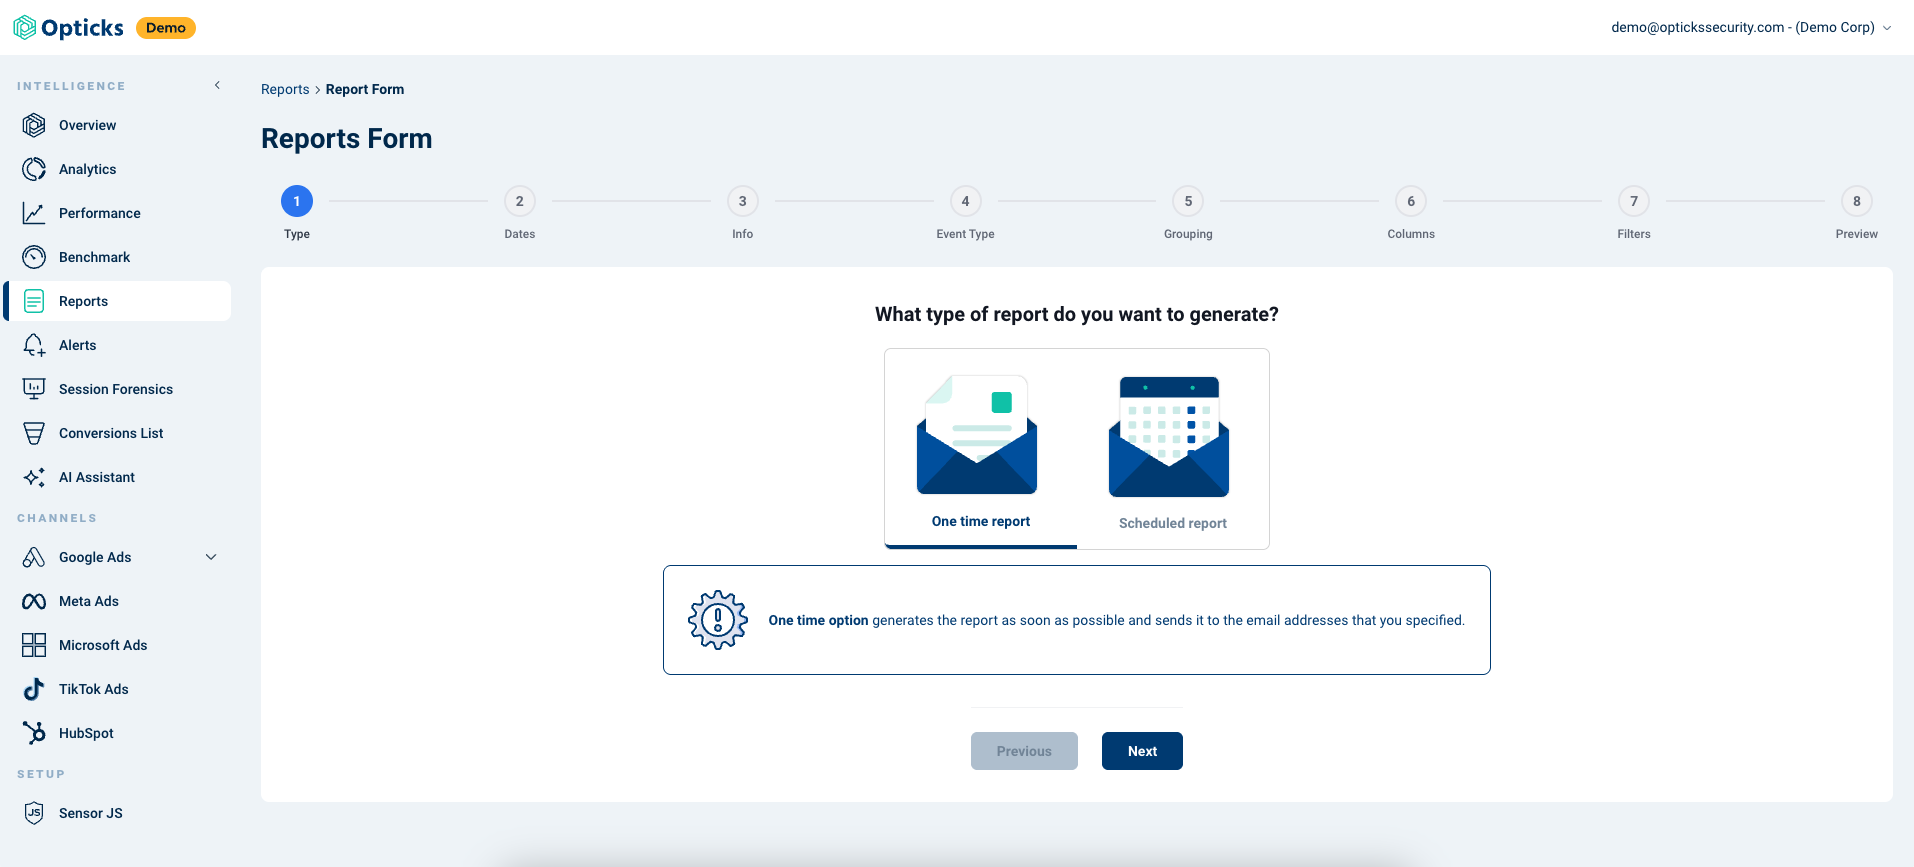
After clicking on the "New" button on the top right you will get a wizard that will help you to create either a one-time report or a scheduled report in a few easy steps.

One time report: this kind of report will be sent to the email(s) you specify and it will contain the exact data you request.
Scheduled report: the recurrent report will be generated whenever your decide, taking into account the timezone configured into your account.
The powerful Filter section allows you to filter by all the same variables present in the Analytics section, even by your own custom variables.
Grouping is a very useful layer that will pre-process the data for you and group it based on your criteria. When doing this, you can decide which data to group by and Opticks will add a column counting the occurrences of each group. One example of possible report would be "Number of blocked transactions by campaign, country and device type".
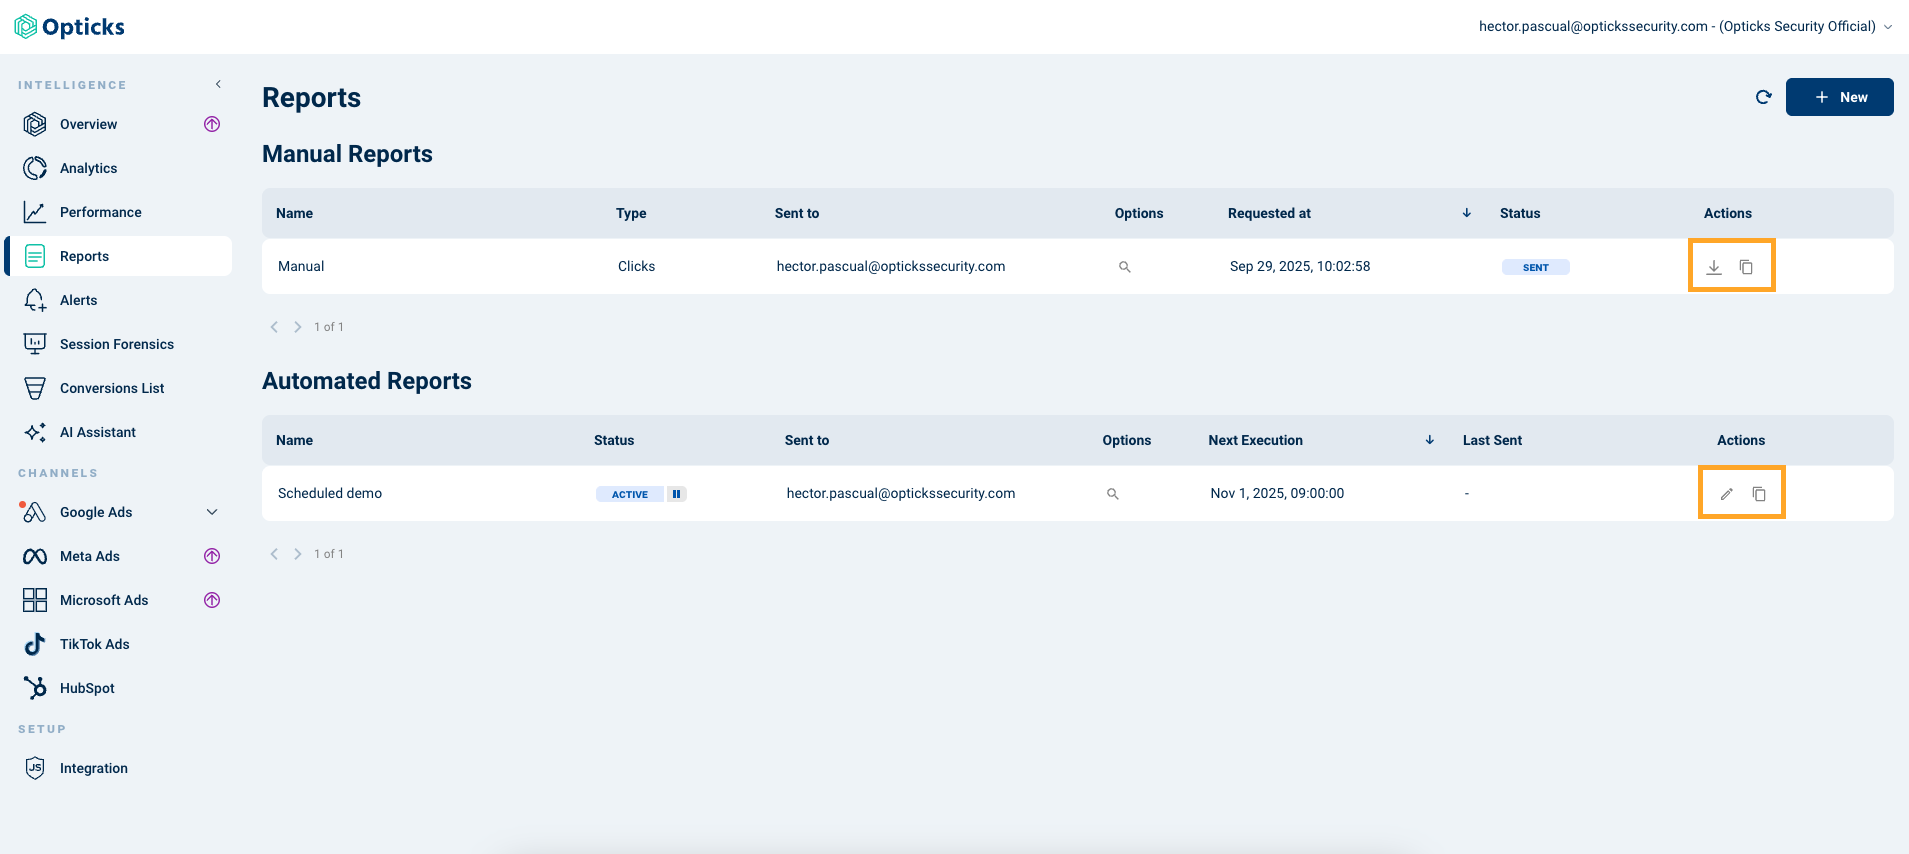
When you create reports, they appear listed in your reports section. From there you can download them, edit them (in the case of Scheduled reports) or Clone them to quickstart the creation of a new report.

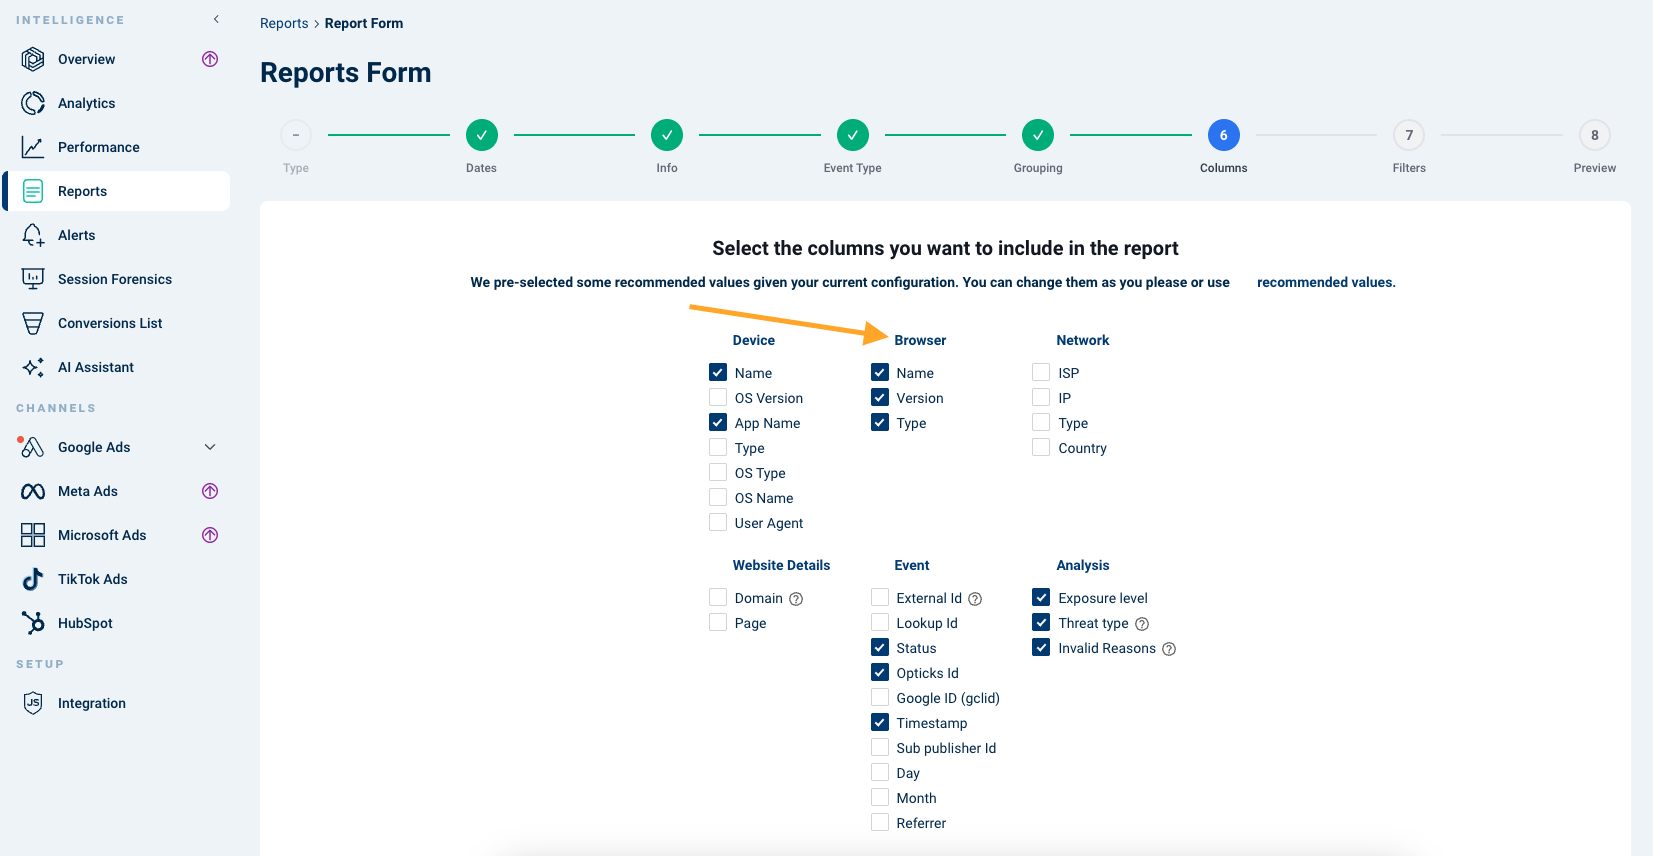
Pro tip: when selecting the values you want to include in your report, if you click the header of a column, all the values get selected automatically.
