Create and explore custom views of your data
Opticks allows to create custom views of your data and explore them granularily. This helps you better comprehend your traffic and guide the decision-making of your antifraud function.
To create a custom view of your data:
- Go to the Analytics section of your Opticks Back Office.
- Select the date range from the selector at the top right of the page
- Select the applicable dimensions.
- Click on
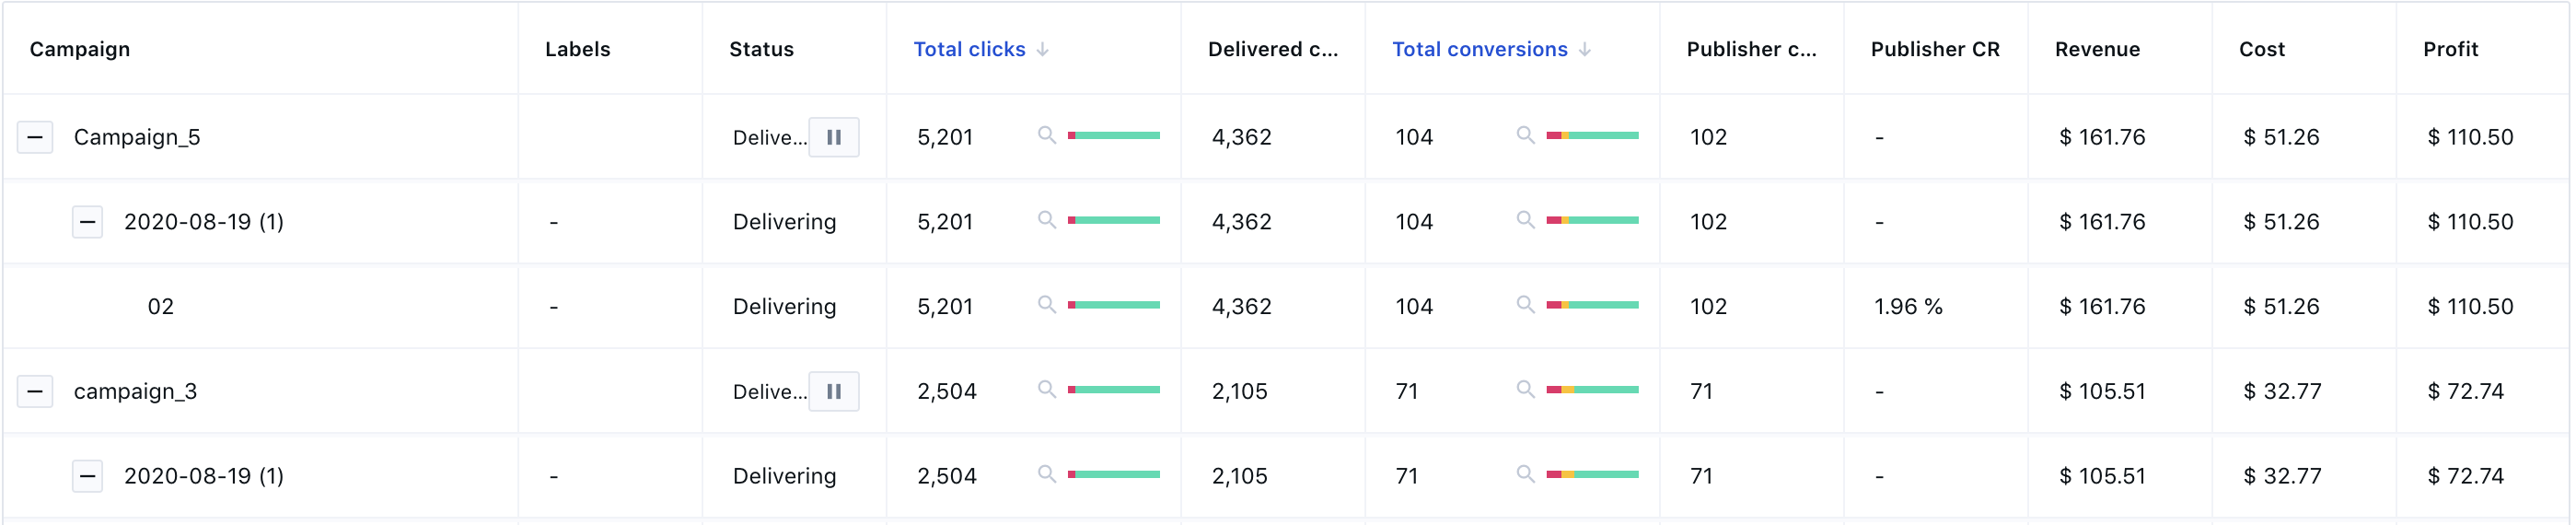
Your custom view will appear as in the example below. Note: By selecting different orders in the dimensions you will be able to explore your data in endless ways (i.e. Device>Browser>Country, or Country>Browser>Device).
You can expand your view to obtain added granularity of your fraud exposure. To do so:
- Click on
 to expand to the next dimension
 - Click on
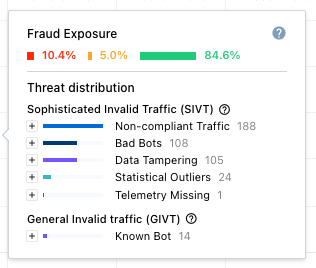
 or in the colored bar at any given set of data to obtain a detailed level of fraud exposure, such as below.
Within a view, you can also customize the columns. To do so:
- Click on the "Column" dropdown
- Select the relevant variables from the dropdown menu
The new variables will be automatically populated in your view.
Note: These custom views can be shared with teammates and kept for future easy access. Simply copy the updated URL (from the URL bar on your browser) once the view has been generated.